Key performance metrics for manufacturing are essential for understanding how well a production facility is operating. These metrics not only help in assessing productivity and efficiency but also play a crucial role in improving operational performance. Here’s a quick overview of the top metrics that matter most in manufacturing:
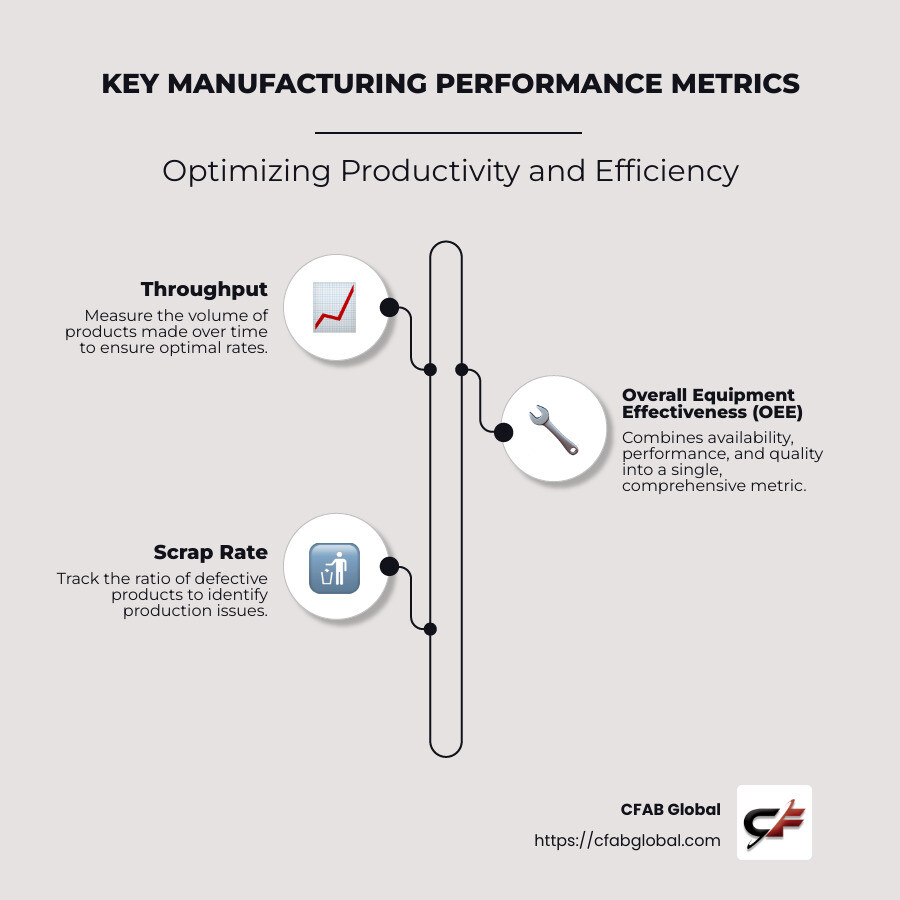
- Throughput: Measures the volume of product made over time to ensure optimal production rates.
- OEE (Overall Equipment Effectiveness): Combines availability, performance, and quality into a single, comprehensive metric.
- Scrap Rate: Tracks the ratio of defective products, providing insights into production issues.
- Cycle Time: The total time from order to completion, indicating the speed and efficiency of production processes.
- Planned Maintenance: Schedules and tracks maintenance activities to minimize downtime.
Effective tracking and management of these key performance metrics can guide a manufacturing facility towards improved productivity and cost efficiency. Each metric, when accurately measured and analyzed, offers insights that drive decision-making and continuous improvement.
I’m Todd Cleppe, an expert in key performance metrics for manufacturing, with over 25 years of experience in engineering and machinery processes. My focus has been on using these metrics to improve machinery efficiency and reduce downtime across various industries. Transitioning to the next section, we will dig deeper into how these KPIs vs. metrics contribute to achieving business goals and operational excellence.
Key performance metrics for manufacturing terms to remember:
– how to calculate efficiency
– industrial machinery efficiency
– manufacturing efficiency
Understanding Key Performance Metrics for Manufacturing
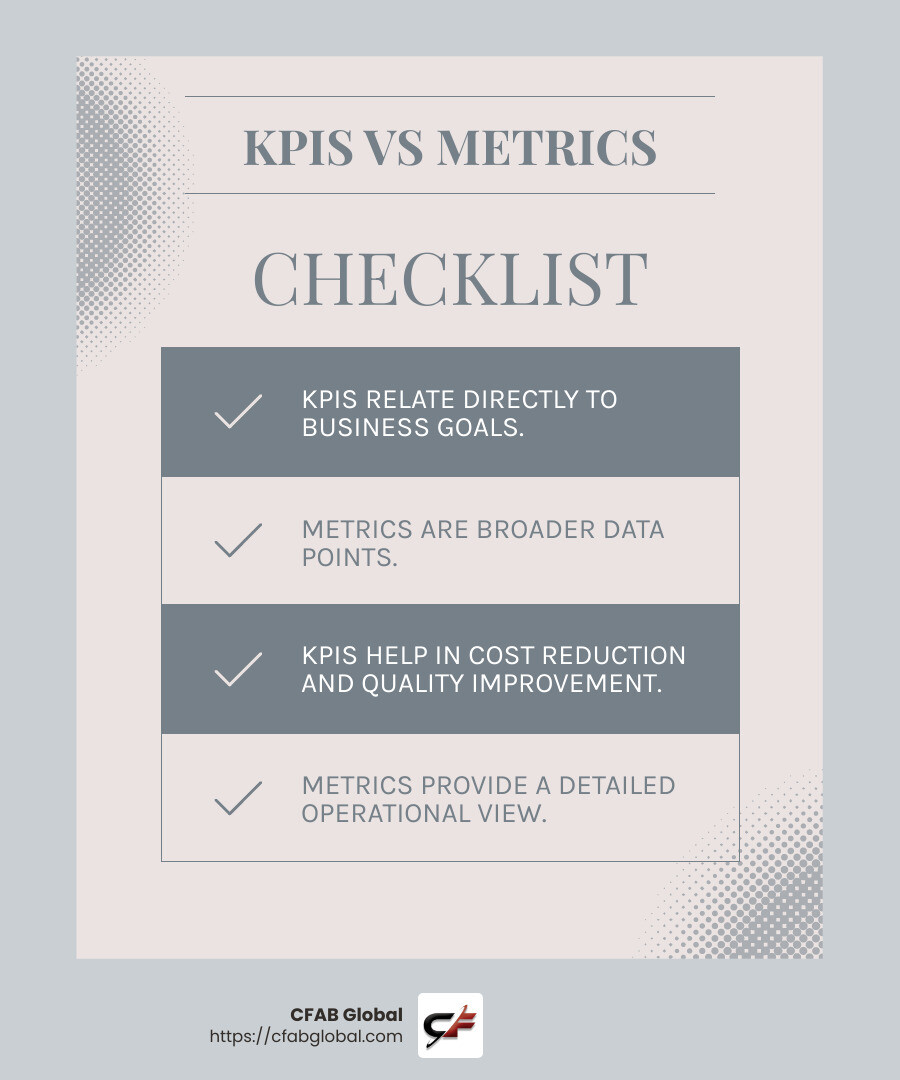
Key Performance Indicators (KPIs) vs. Metrics: Let’s break it down. KPIs are the critical metrics that directly relate to your business goals. They’re like the vital signs of your manufacturing process, telling you how well you’re doing in key areas like production speed, quality, and cost efficiency. Metrics, on the other hand, are the broader set of data points that give you a detailed view of your operations. Think of them as the building blocks that help you understand the bigger picture of your manufacturing performance.
Quantifiable Measurements: In manufacturing, the numbers tell the story. Quantifiable measurements are essential because they provide concrete data that can be analyzed and acted upon. For example, tracking throughput or the volume of product produced over a specific period, gives you a clear view of your production capabilities. Similarly, Overall Equipment Effectiveness (OEE), which combines availability, performance, and quality, offers a comprehensive snapshot of your equipment’s efficiency.
Business Goals: Every manufacturing operation has targets—be it reducing costs, improving product quality, or increasing production speed. KPIs serve as a bridge between your day-to-day operations and your overarching business goals. By aligning your KPIs with these goals, you can ensure that every effort made on the production floor contributes to the larger objectives of your organization. For instance, if customer satisfaction is a primary goal, monitoring the on-time delivery KPI can help ensure that you meet customer expectations consistently.
Understanding and leveraging key performance metrics for manufacturing is about making informed decisions that drive your business forward. By focusing on the right KPIs, manufacturers can optimize their processes, improve efficiency, and ultimately achieve their strategic objectives.
Let’s explore the top 12 key performance indicators for manufacturing and how they can be used to optimize your operations.
Top 12 Key Performance Indicators for Manufacturing
On-time Delivery
On-time delivery is crucial for maintaining customer satisfaction. This KPI measures the percentage of orders delivered by the promised date, reflecting your ability to meet customer expectations. A high delivery success rate not only boosts your reputation but also ensures customer loyalty. As one CEO put it, “What good is a 100% OEE if we don’t have any customers to sell our product to?” Tracking this KPI helps you identify bottlenecks and streamline processes.
Production Schedule Attainment
Production schedule attainment focuses on meeting planned production targets. It highlights performance issues and aids in production planning. By calculating the ratio of actual output to planned output, manufacturers can set benchmarks and adjust schedules to minimize delays. Consistently hitting your production targets ensures a smooth workflow and reduces the risk of costly disruptions.
Total Cycle Time
Total cycle time measures the time taken from the start of production to the shipment of goods. It excludes breaks and waiting periods, focusing solely on active production. This KPI is vital for understanding how efficiently orders are completed and how machine cycle time compares to the ideal. Reducing cycle time can improve throughput and lower costs.
Throughput
Throughput is all about machine performance. It tracks the number of units produced over a given period. This KPI is often reviewed in real-time to address issues before they escalate. Assigning skilled operators to machines and maintaining equipment in top condition can maximize throughput, ensuring seamless production.
Capacity Utilization
Capacity utilization measures whether machines are working at their full potential. High utilization indicates that resources are being used efficiently, while low utilization may signal machine downtime or other inefficiencies. Maintaining machines in good condition and minimizing downtime can improve capacity utilization, lowering production costs.
Changeover Time
Changeover time monitors the duration needed to prepare for a new production run, including tasks like retooling and calibrating. Reducing changeover time through effective production run setup and staff training can significantly cut costs and improve efficiency. Quick changeovers mean less downtime and more production time.
Yield
Yield, or First Time Through, measures the percentage of products manufactured without defects. A high yield indicates fewer product defects and less waste. By striving for a high yield, manufacturers can uphold quality standards and reduce costs associated with rework and scrap.
Scrap
Scrap refers to materials that fail to meet quality standards and are discarded. Monitoring scrap rates helps in identifying areas for improvement and cost reduction. By minimizing scrap, manufacturers not only save on material costs but also improve overall product quality.
Planned Maintenance
Planned maintenance is essential for minimizing unexpected breakdowns and maintenance costs. This KPI tracks the proportion of maintenance that is scheduled rather than reactive. Less than 15% of maintenance should be emergency work. By planning maintenance activities, manufacturers can avoid costly downtime and ensure smooth operations.
Availability
Availability measures the proportion of time a machine is operational and ready for use. It includes both planned and unplanned downtime, providing insights into machine uptime. Understanding availability helps identify downtime causes and areas for improvement, ensuring efficient production processes.
Customer Return Rate
Customer return rate tracks the percentage of goods returned due to defects or dissatisfaction. A high return rate can damage your reputation and indicate quality issues. By monitoring this KPI, manufacturers can address problems promptly and maintain a positive brand image through effective reputation management.
Overall Equipment Effectiveness (OEE)
Overall Equipment Effectiveness (OEE) is a comprehensive metric that combines availability, performance, and quality. It provides a holistic view of how effectively equipment is used. Regularly monitoring and improving OEE can lead to significant improvements in operational efficiency and productivity.
Understanding these key performance metrics for manufacturing is essential for optimizing processes and achieving strategic business goals. By focusing on these KPIs, manufacturers can drive improvements, reduce costs, and maintain high standards of quality and customer satisfaction.
How to Make Manufacturing KPIs Actionable
To truly benefit from key performance metrics for manufacturing, it’s crucial to turn data into action. Here’s how you can do it effectively:
Stakeholder Feedback
Gathering insights from stakeholders is vital. They offer perspectives that can refine your KPIs. For instance, feedback from the production floor might reveal bottlenecks that aren’t apparent from data alone. Engaging stakeholders ensures that KPIs remain relevant and aligned with day-to-day realities.
Quote from a Manufacturing CEO:
“As long as we are hitting our delivery targets, we’re less concerned about OEE. What good is a 100% OEE if we don’t have any customers to sell our product to?”
This highlights the importance of balancing different KPIs based on business needs and stakeholder priorities.
Business Strategy Alignment
Aligning KPIs with your business strategy is non-negotiable. Your KPIs should reflect what your company aims to achieve, whether it’s reducing costs, enhancing quality, or improving customer satisfaction. For example, if your strategy focuses on efficiency, metrics like cycle time and throughput should be prioritized.
Use tools like enterprise manufacturing intelligence (EMI) systems to integrate real-time data from various sources, ensuring that your KPIs are always up-to-date and relevant. This alignment helps in making informed decisions that drive business growth.
Steps to Align KPIs with Strategy:
-
Define Clear Objectives: Know what you want to achieve. Whether it’s boosting productivity or reducing waste, clear goals guide KPI selection.
-
Select Relevant Metrics: Choose KPIs that directly impact your objectives. For instance, if downtime is a concern, focus on availability and planned maintenance.
-
Use Real-Time Data: Implement dashboards that provide real-time insights. This helps in quickly identifying issues and opportunities for improvement.
-
Review and Adjust: Regularly assess your KPIs to ensure they remain aligned with evolving business goals and external conditions. Adjust them as necessary to stay on track.
By focusing on stakeholder feedback and aligning KPIs with your business strategy, you can make these metrics actionable, driving improvements across your manufacturing operations.
Visualizing Progress
Utilizing dashboards can make KPI data more accessible and actionable. These tools present information in a user-friendly format, allowing stakeholders to quickly grasp performance levels and trends. For instance, a dashboard showing scrap rates and yield can pinpoint areas needing immediate attention.
Example Dashboard Features:
- Real-Time Updates: Keep everyone informed with the latest data.
- Customizable Views: Tailor dashboards to show the most relevant KPIs for different teams.
- Interactive Elements: Enable users to drill down into specific metrics for deeper insights.
By making KPIs actionable, manufacturers can not only track performance but also drive continuous improvement, aligning operations with strategic goals. This approach ensures that KPIs are not just numbers but tools for enhancing efficiency and achieving excellence.
Frequently Asked Questions about Key Performance Metrics for Manufacturing
When it comes to understanding key performance metrics for manufacturing, several questions often arise. Let’s dig into some of the most common inquiries and clarify these essential concepts.
What are the standard KPIs for manufacturing?
In manufacturing, standard KPIs play a critical role in assessing performance and guiding decisions. These include:
-
Financial Metrics: These are vital for understanding the economic health of your operations. Metrics like net profit margin, return on assets, and manufacturing cost per unit help in evaluating profitability and cost-effectiveness.
-
Customer Service Metrics: These KPIs focus on customer satisfaction and retention. On-time delivery rates and customer return rates are key indicators of how well you’re meeting customer expectations.
-
Operational Metrics: These measure the efficiency and effectiveness of production processes. Common examples include Overall Equipment Effectiveness (OEE), capacity utilization, and yield. These metrics help identify areas for improvement in production efficiency and quality.
How do KPIs differ from metrics?
While KPIs and metrics are related, they serve distinct purposes:
-
Metrics are broad measurements that track various aspects of business performance. They provide data on everything from production volume to employee attendance.
-
KPIs, on the other hand, are specific metrics that are directly tied to business goals. They are the most critical metrics that indicate success in achieving strategic objectives. For example, while production volume is a metric, on-time delivery might be a KPI if customer satisfaction is a top priority.
The key difference lies in their impact on decision-making. KPIs are designed to help businesses make critical decisions by focusing on what truly matters for achieving business goals.
Why should manufacturers use KPIs?
Manufacturers should leverage KPIs for several compelling reasons:
-
Customer Satisfaction: KPIs like on-time delivery and customer return rates directly influence customer satisfaction. By monitoring these, manufacturers can ensure they meet or exceed customer expectations, leading to repeat business and positive word-of-mouth.
-
Cost Reduction: KPIs help identify inefficiencies and areas where costs can be cut without compromising quality. For instance, tracking scrap rates and planned maintenance can lead to significant savings.
-
Critical Decisions: With data-driven insights, manufacturers can make informed decisions about where to invest resources, which processes to optimize, and how to align operations with strategic goals. This proactive approach ensures that the business stays competitive and profitable.
By focusing on the right KPIs, manufacturers can improve their operational performance, improve customer satisfaction, and achieve financial success. These metrics are not just numbers; they are strategic tools that drive business growth and efficiency.
Conclusion
At CFAB Global, we understand that achieving operational efficiency is more than just tracking numbers—it’s about changing data into actionable insights. Our Machine Reliability Program is designed to do just that. By focusing on key performance metrics for manufacturing, we help businesses improve productivity, minimize downtime, and extend the lifespan of their machinery.
Operational Efficiency is the cornerstone of successful manufacturing. It’s about optimizing every aspect of production to ensure quality and cost-effectiveness. With our custom solutions, CFAB Global empowers manufacturers to leverage real-time data to make informed decisions that align with their strategic goals.
Our Machine Reliability Program is not a one-size-fits-all solution. We work closely with each client to develop strategies that meet their unique needs. From predictive maintenance to customized training, we offer comprehensive support to ensure your machinery operates at peak performance. This proactive approach not only reduces unexpected breakdowns but also improves the overall efficiency of your operations.
With CFAB Global by your side, you can focus on what matters most: growing your business and satisfying your customers. Our industry expertise and commitment to excellence make us the ideal partner for manufacturers looking to thrive in a competitive landscape.
For more information on how we can boost your operational efficiency, explore our Machine Reliability Program. Let us help you open up the full potential of your manufacturing processes and achieve sustainable success.
